By leveraging advanced analytics platforms, manufacturers are gleaning invaluable insights from process data without needing to manually and laboriously comb through disparate data sources. See examples of hidden data found to help operational goals.
Learning Objectives
-
- Understand data-wrangling challenges for process engineers and industrial operations and how advanced analytics platforms provide real-time answers.
- Explore how a company used advanced data analytics to increase steam recovery to reduce greenhouse gas emissions.
- Learn about visibility of environmental awareness and resource preservation by empowering the workforce with advanced analytics toolsets.
Insights
- Help manufacturers shift from manual data wrangling to automated insights with real-time data analytics
- Demonstrate how advanced analytics platforms are empowering organizations and their subject matter exp
Industrial organizations’ reliance on digital technologies to gather, monitor and compile data in real time is nothing new. With endless streams of process data from around-the-clock operations and instrumentation, facility subject matter experts (SMEs) can analyze the information to identify events requiring responsive action, as well as opportunities for operational optimization. See examples, below.
While the need for optimization to drive profitability has been constant, the increasing global focus on environmental preservation is prompting companies around the world to integrate sustainability pledges into their vision and strategy. However, 2022 research from Accenture shows that 93% companies polled will fail to achieve their goals without at least doubling their current pace of emissions reduction by or before 2030, according to the Accenture study, “Accenture Net Zero by 2050 Global Report.”
Meeting ambitious corporate sustainability and other objectives requires a combination of capital investments, production optimization and reliability enhancements in operations. Advancements in data analytics and industrial enterprise monitoring are particularly critical for organizations to continue progressing toward their commitments, with modern industrial analytics platforms playing a critical role in success. These software platforms evolved over the last couple of decades from basic self-service data extrapolation applications, to open and extensible platforms, optimized to guide critical operational decision-making with enterprise-wide operational intelligence.
Data-wrangling challenges for process engineers, industrial operations
Despite the giant leaps of analytics applications, a staggering number of process engineers, data scientists, and other SMEs are still stuck using spreadsheets for data aggregation and analysis. Spreadsheets are wrought with limitations, including subpar computational capability, lack of live data connectivity, prohibitively difficult shareability and clumsy visualization and reporting functionalities.
Void of live connections to historical and live data sources, SMEs are forced to manually query each individual database, extract the necessary data for analysis, then aggregate, cleanse and align mismatched timestamps. When a new time period of interest is identified, the process must be repeated.
With so many hoops to jump through, it is easy to understand why 49% of global business leaders report data collection and reporting as an obstacle to meeting their net-zero, emissions-reduction and optimization goals, according to the “Economist” document, “Pain Point 10: Inconsistent measurement and reporting standards.”
Advanced analytics platforms provide a reprieve
Fortunately for today’s industrial SMEs, modern advanced analytics platforms help overcome data silo and manual wrangling challenges by providing automated access to each data source without transferring or duplicating information from one repository into another. Instead, these unifying platforms provide centralized access to data in their original systems of record, including process historians, laboratory information management systems, manufacturing execution systems, data lakes and more.
These platforms break down data access barriers, while also future proofing data storage and architecture decisions, and speeding up time to insights for teams trying to solve complex problems. Equipped with live access to each data source from one location, users can employ advanced analytics to justify sustainability projects, streamline and automate reporting, and improve operational intelligence at scale.
Increasing steam recovery to reduce greenhouse gas emissions
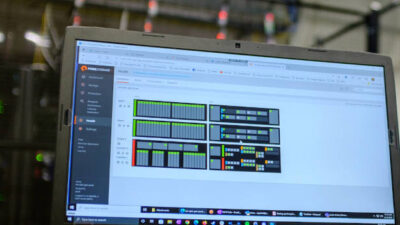
Allnex, a global producer of industrial coating resin and additives, used an advanced analytics platform to develop a supervised machine learning algorithm to calculate total steam demand based on instrument data and steam valve positions. The platform enables the team to visualize area steam flow rates, control valve on/off stat uses and monitor steam demand from equipment throughout the facility, such as steam ejectors (Figure 1).
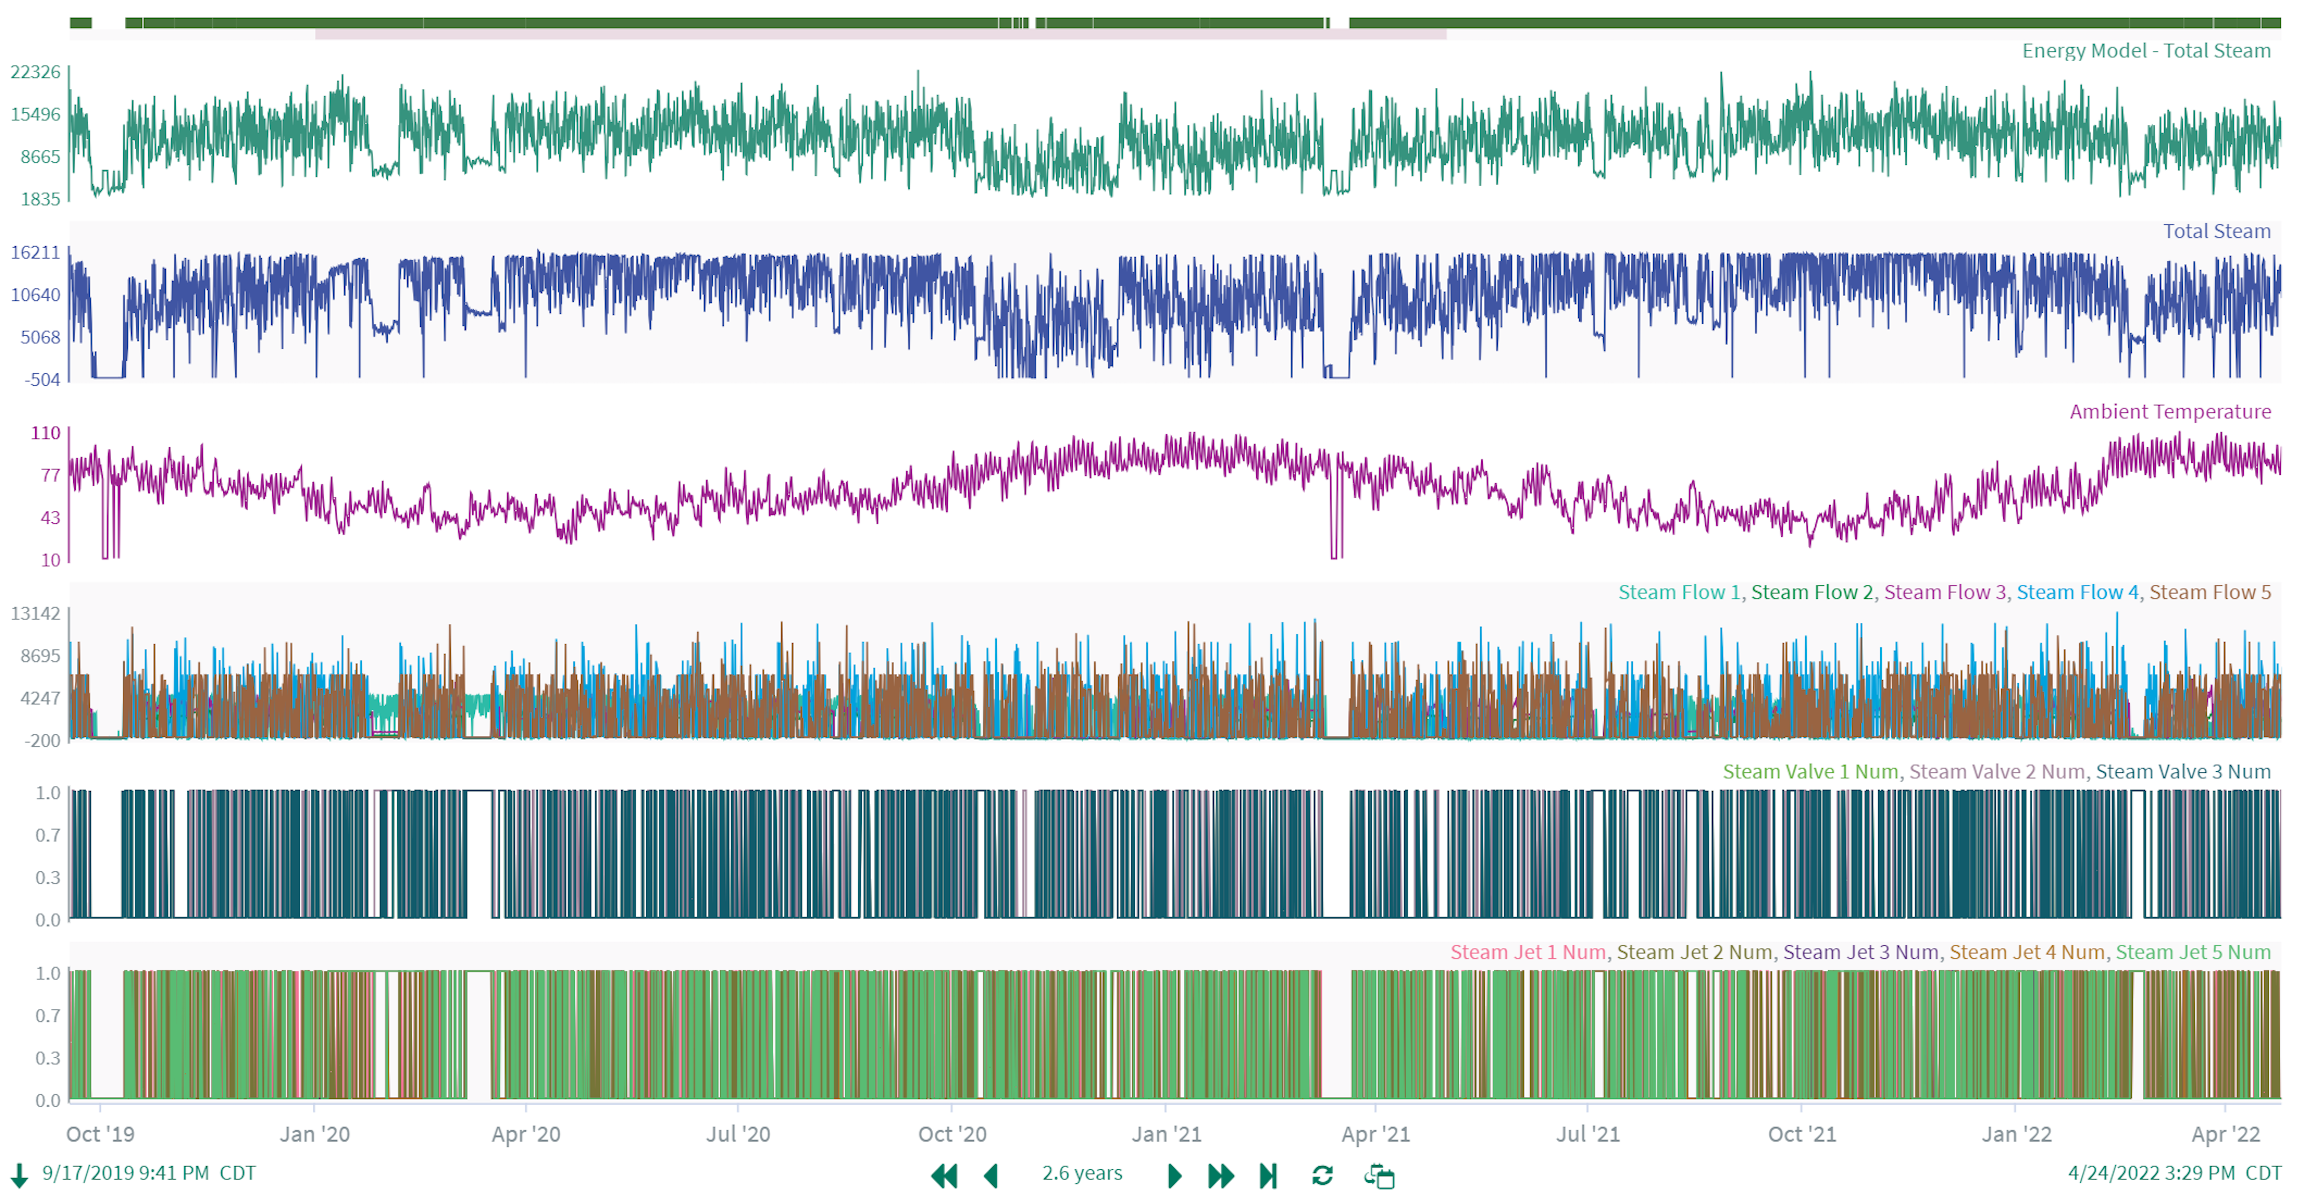
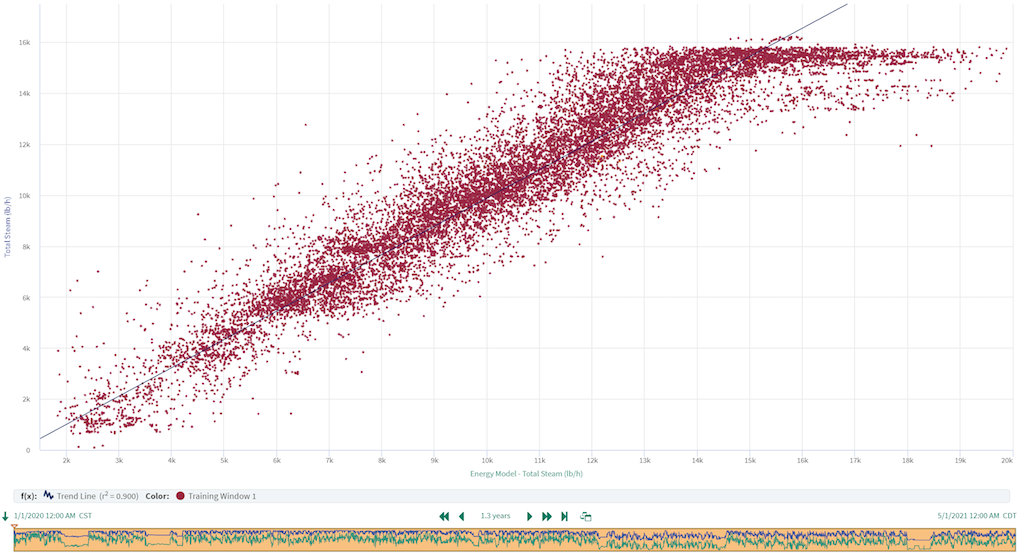
The software also tracks ambient temperature to account for seasonal variability and environmental influences. By leveraging the contextualized information, SMEs can identify and eliminate insignificant offline periods, which increase model accuracy. The model is easily visualized with statistical performance metrics, providing the Allnex team with insights and parameters to understand underlying patterns in the data (Figure 2).
These insights empowered engineers to prioritize investigation of failed valves and steam traps, based on statistical significance in the model. As a result, the energy model also enabled the company to identify process anomalies throughout the entire automation system to improve energy efficiency and reduce OPEX.

In one instance, the model returned an unexpected result, in which the steam ejector isolation valve did not provide statistical significance, indicating potential equipment malfunction. The valve was tested, and the team determined it was not properly closing, causing waste during idle periods. After creating and deploying a baseline energy model, deviations from the baseline were used to prioritize maintenance efforts and initiate investigations, suggesting when instruments and equipment had likely failed.
As a result, the company improved steam recovery by 30% while reducing steam consumption by 15%. Additionally, it reduced greenhouse gas (GHG) emissions by approximately 4,600 tons of CO2e per year, according to the U.S. Environmental Protection Agency (EPA) green house gas emissions data [link to https://www.epa.gov/system/files/documents/2023-03/ghg_emission_factors_hub.pdf] which is equivalent to the carbon footprint of 1,000 passenger vehicles on the road in a year or 86,600 MMBTU of natural gas, according to EPA greenhouse gas vehicle emissions data.
Excelling in environmental awareness and resource preservation
With one-third of the world’s carbon emissions linked to food production, 12% is tied to agriculture and the remainder to supporting industries, such as crop protection product manufacturers, like Syngenta. Syngenta is working to combat emissions, setting an ambitious carbon reduction goal of 50% by 2030. Additionally, the company set a goal to reduce its process water consumption and waste by 20%.
Syngenta began working toward this large objective with product lifecycle assessments, which focus on a company’s primary products and measure the total amount of carbon emissions released during production from “cradle to grave.” The results create an understanding of the carbon cost per unit of chemical produced and where in the process it comes from.
The most challenging and time-consuming component of performing lifecycle assessments is collecting the necessary data. In one of the company’s plants, the lifecycle model included 501 process variables. It took a full-time consultant six months on-site to build out the data structure and flow for just one assessment, an approach that was clearly unsustainable for the company to perform year-over-year, site-over-site and product-over-product.
Rather than repeat this six-month process for each new addition to the lifecycle assessment, Syngenta leveraged innovative technologies designed for broad-reaching data access. It first connected its analytic software to all available site data in its historian and asset management software to provide data cleansing, aggregation, labeling and sorting capabilities, which reduced the six-month marathon to a three-day sprint. In addition to accelerating the time to prep data, this approach using raw measured data helped Syngenta score highly on data quality, which is measured against guides and standards in lifecycle assessments.
Syngenta has built out an active and continuously updating lifecycle assessment tool using Seeq, which is providing greater visibility into opportunities for improvement. For example, while examining a monitoring dashboard, an engineer noticed the carbon quantity per product mass did not reduce proportionally during a production slowdown (Figure 3).
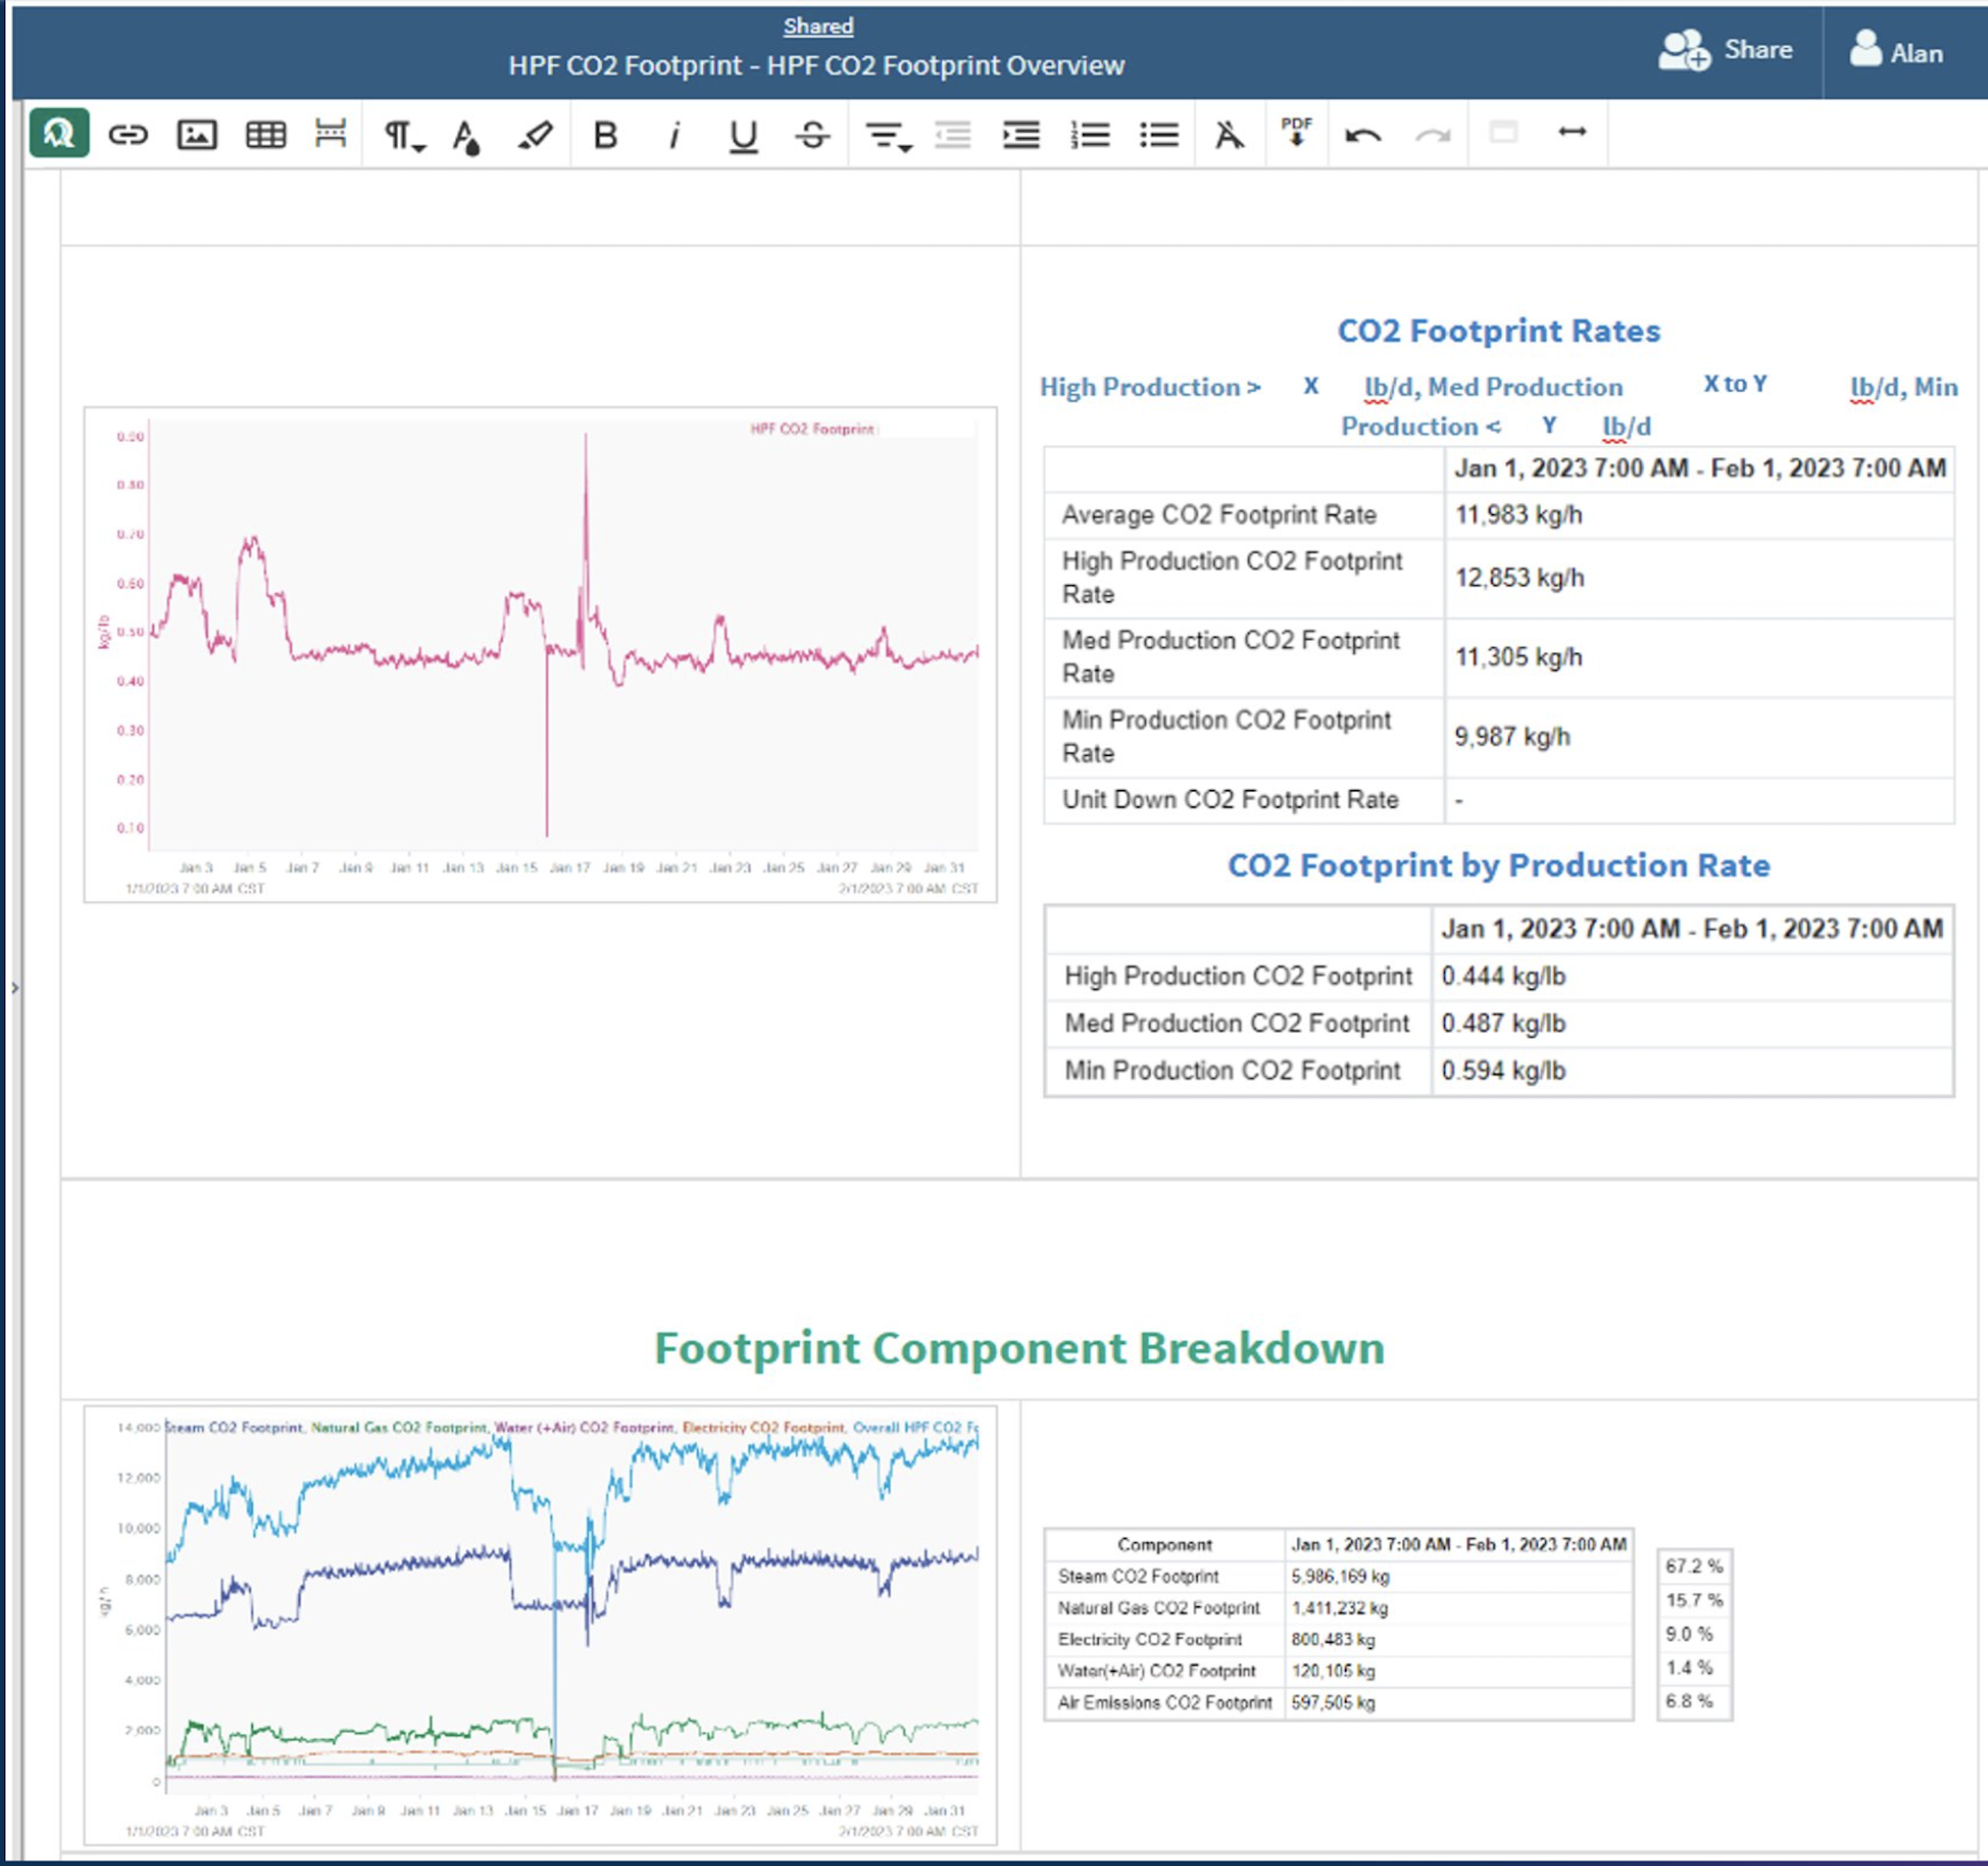
Examining that period further, the engineer calculated a 33% higher proportion of carbon released per pound of product when running at minimum rates compared to running at target, highlighting the criticality of meeting productivity goals. Today, the company uses this result to compute overall equipment effectiveness percentage improvement in terms of carbon reduction.
Empower the workforce with advanced analytics toolsets
In today’s data-centric landscape, providing staff with the tools needed to contextualize, analyze and make the right decisions is critical for operational optimization. Powerful technology by itself does not ensure success, but software with wide-reaching connectivity, automated data cleansing, cloud access, proficient algorithms and intuitive sharing capabilities significantly spur organizational innovation and process improvement.
Additionally, advanced analytics platforms designed to scale high-value use cases across assets can accelerate progress toward sustainability and productivity initiatives. By empowering employees with these tools, industrial organizations are improving process insights, streamlining their operations, enhancing productivity and product quality, increasing the bottom line and meeting ambitious sustainability pledges.